Graphs & Charts
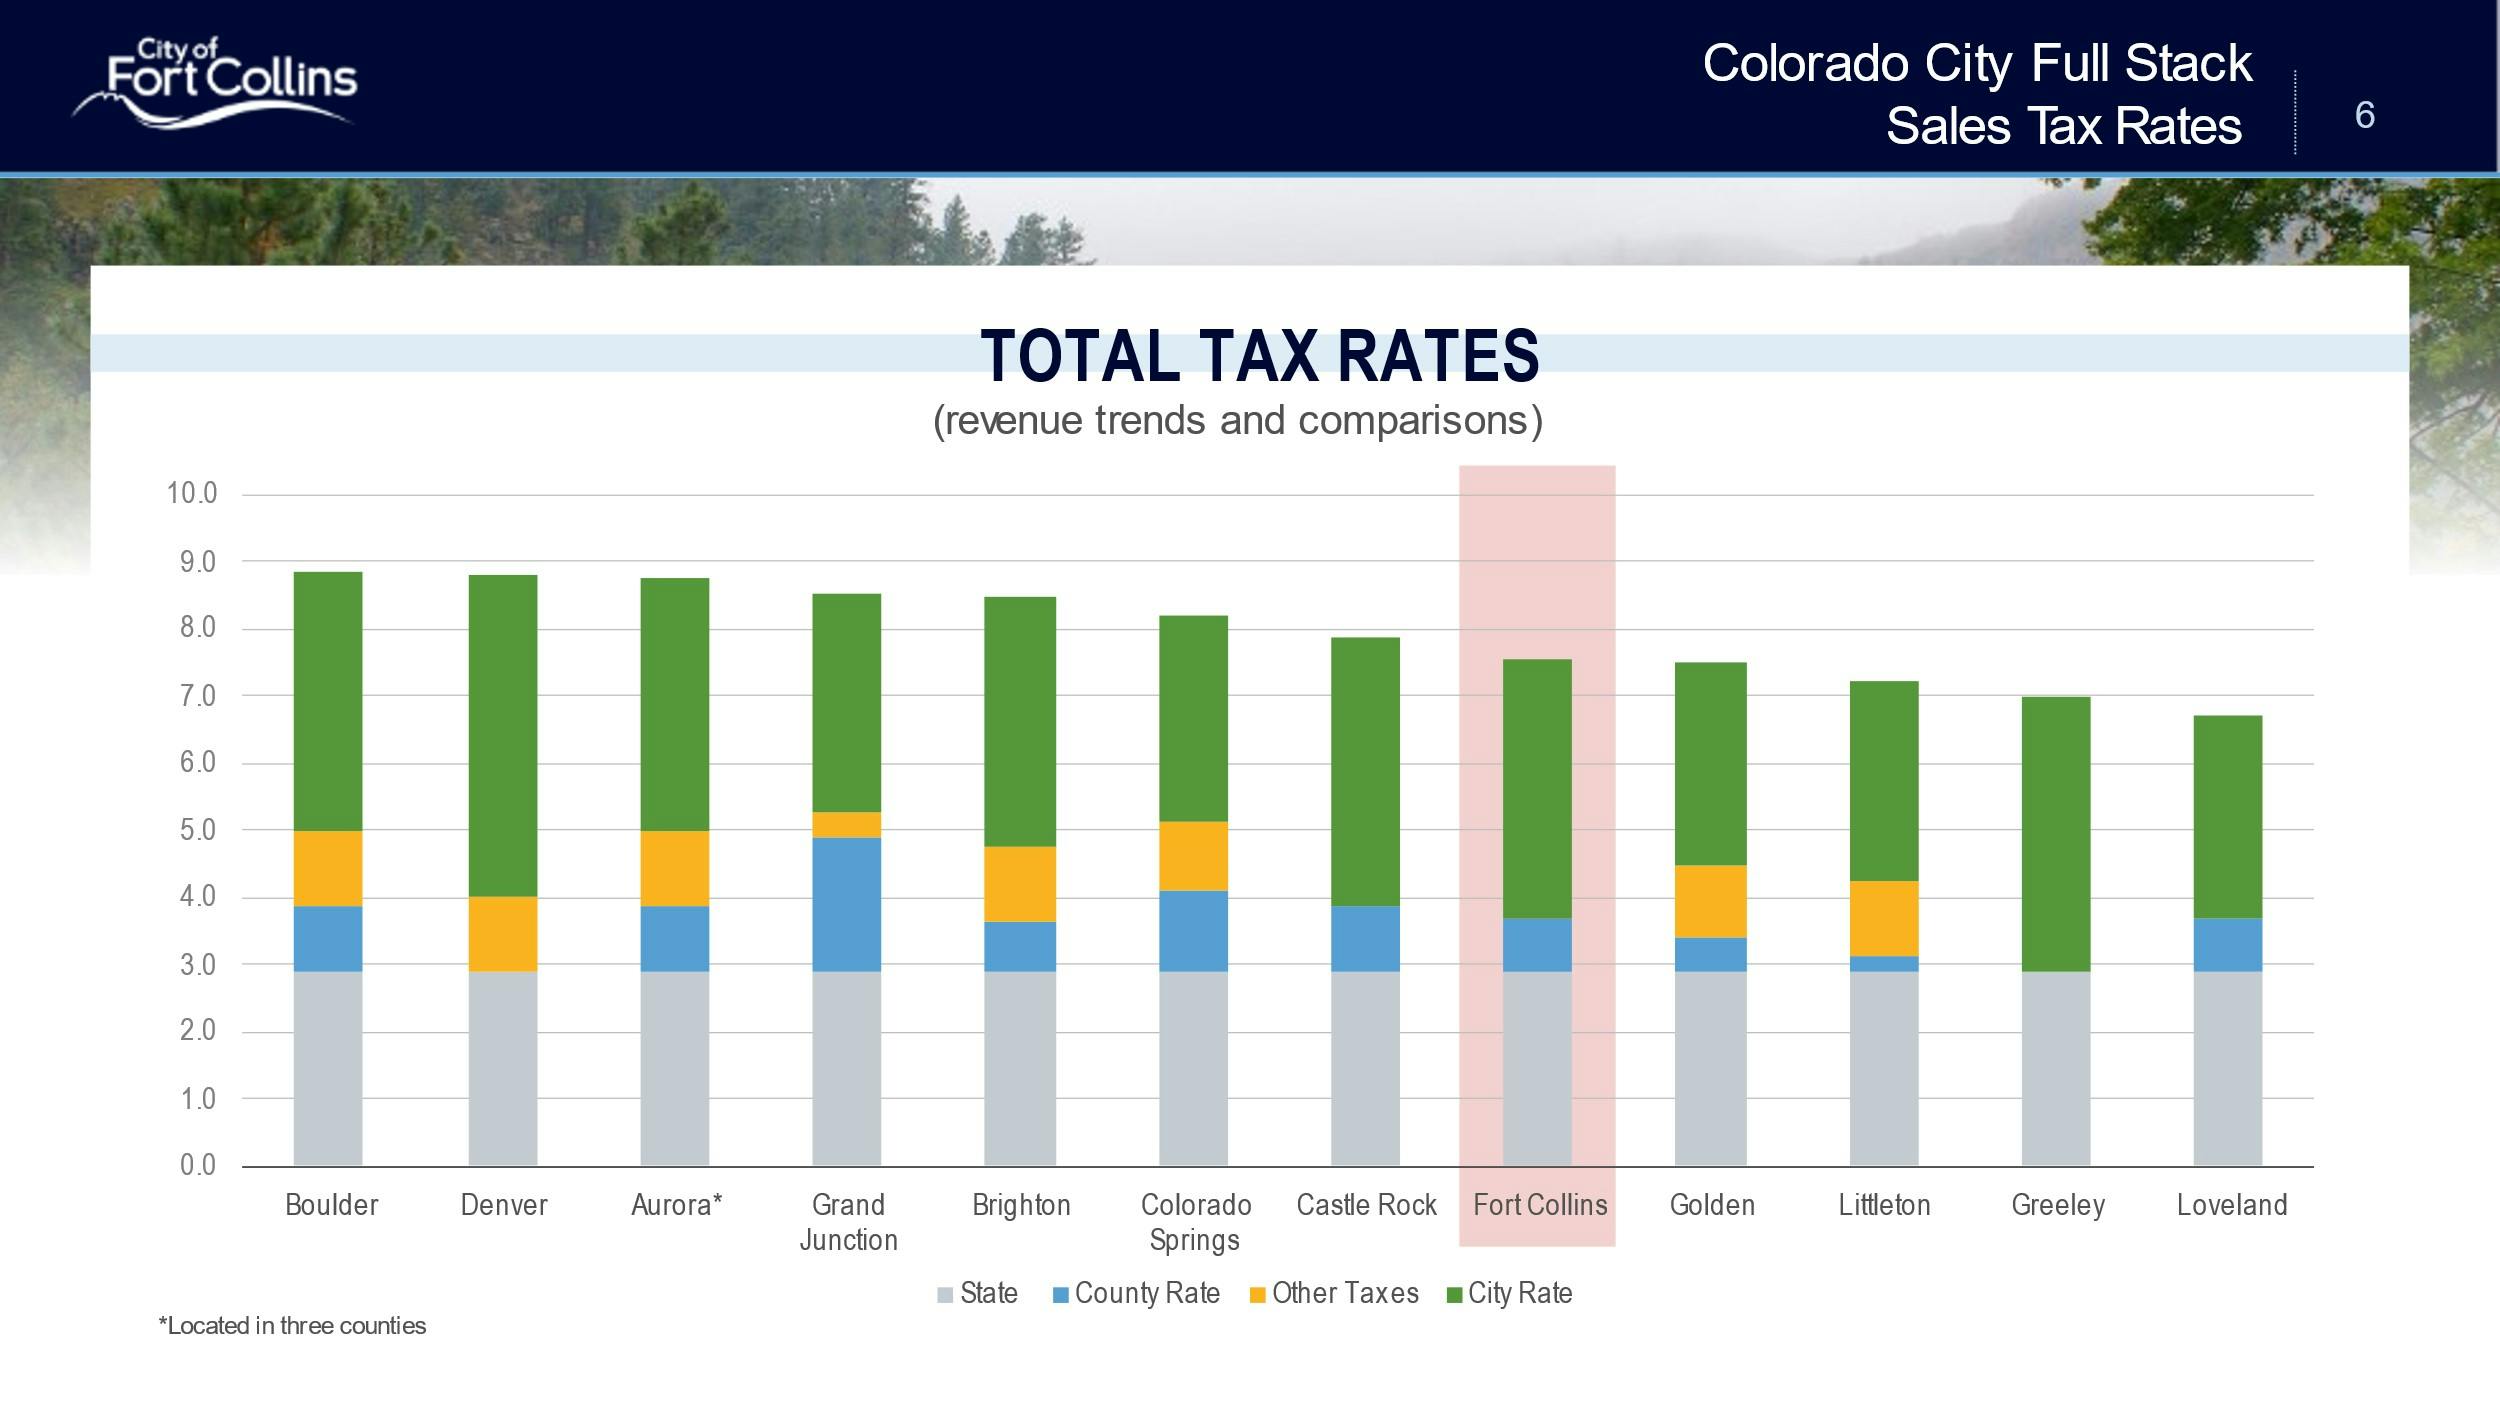
The graph compares total tax rates across twelve cities in Northern Colorado. Fort Collins is on the lower end of the rankings. All counties except Douglas and Larimer have other taxes linked to transportation, culture and public safety.